In the wake of Hurricane Helene, Teren worked with USGS data to validate its innovative approach to predicting landslides triggered by extreme weather events.
Mapping the Risks: Before and After Helene
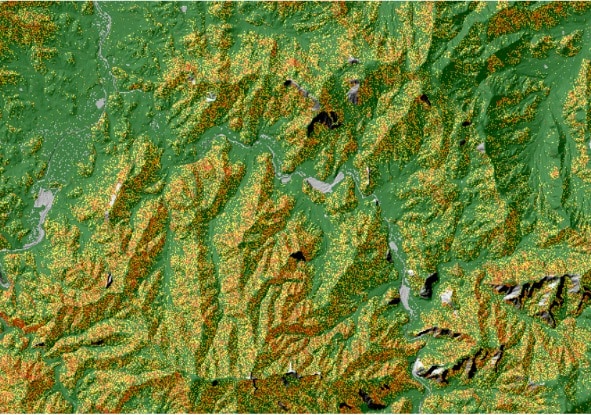
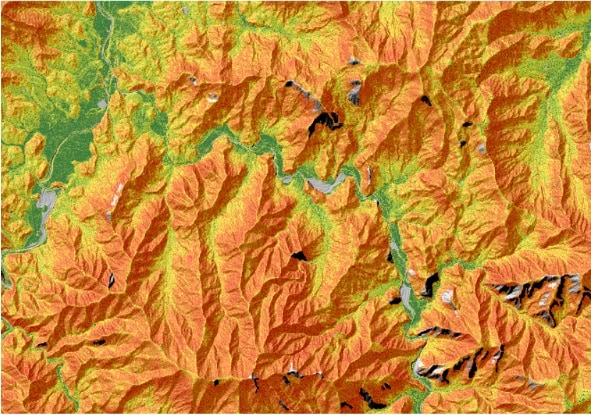
The study used Teren’s slope stability analysis, which calculates a balance between resisting and driving forces in soil. The analysis began with a pre-Helene baseline, modeling the stability of slopes under normal, field-capacity moisture levels. This was compared to conditions after the hurricane, which brought up to nine inches of rain in 24 hours. The findings were striking:
- Before Helene: Most slopes appeared stable, with high slope stability (green areas on the map).
- After Helene: Saturated soils and increased pore pressure led to widespread instability, even on gentle slopes, as reflected in a shift to lower slope stability (red areas).
This dramatic transition underscored the critical role precipitation plays in triggering landslides, with the data revealing a 92% migration of slopes from stable to unstable conditions.
Validating the Model with Real-World Data
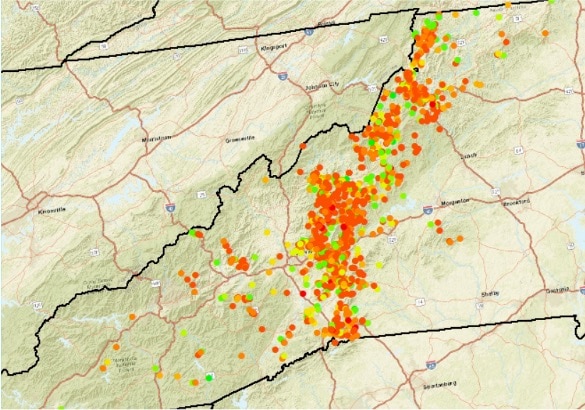
The team cross-referenced these predictions with observed geohazards reported by the USGS post-Helene. Helicopter surveys flagged over 2,000 landslides and debris flows, particularly those near roads, rivers, and structures. By overlaying these observations with Teren’s algorithm, the model demonstrated its accuracy in predicting landslide-prone areas:

From Prediction to Prioritization
While identifying where landslides are most likely is crucial, understanding their potential impact is equally important. Teren’s analysis extended beyond slope stability to include debris flow modeling, tracking how failed material would travel downslope.
By combining hydrology data and soil properties, the team estimated the volume and flow paths of debris, pinpointing areas where critical road infrastructure was at risk.

Why This Matters
Climate-driven events like Hurricane Helene are becoming more frequent, amplifying the need for proactive risk management. Teren’s model bridges the gap between static geotechnical assessments and dynamic climate-responsive modeling.
By providing a clearer picture of where and when landslides may occur, tools like this empower stakeholders to protect communities, infrastructure, and natural resources. This information provides actionable insights for agencies like FEMA and local governments, enabling them to prioritize resources and mitigation efforts effectively.
Stop Guessing. Start Knowing.
Learn more about how Teren can help you predict, prioritize and prevent climate risks from wreaking havoc on your infrastructure network: attend our bi-weekly demo or request a 1-1 demo.
See how Teren’s customers build infrastructure resilience: Customer Stories


How can Teren help you?
We'd love to hear from you.
- Ready to dive deeper? -
Knowledge Hub
White Papers
Webinars