Estimated reading time: 6 minutes
Pipelines face constant challenges from external, natural forces that can compromise safety and operational integrity. Geospatial data science has emerged as an innovative approach to better understanding, predicting, and mitigating these complex environmental risks. By leveraging advanced mapping technologies and sophisticated risk assessment tools, pipeline integrity engineers and operations managers can now anticipate potential threats with unprecedented precision.
What is a Natural Force Threat?
Natural force threats is a term used in pipeline operations to describe any phenomenon occurring in nature that poses a threat to an operator’s right-of-way. This encapsulates both obvious natural disasters like hurricanes and wildfires, but also instances like river scour or erosion.
How Geospatial Data Science is Applied to Pipeline Monitoring
Monitoring Your Pipe: Core Technologies and Data Collection Methods
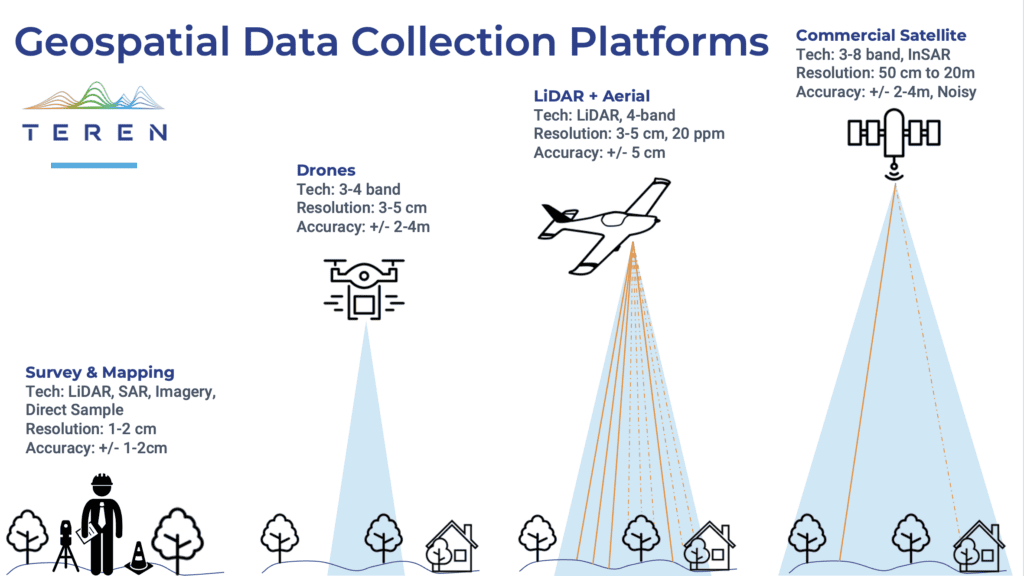
Modern pipeline monitoring begins with robust data collection. The technologies used to collect this data varies; satellites and remote sensing technologies provide large-scale visual insights to detect changes along pipeline routes, while LiDAR scanning delivers precise 3D topographical data, identifying terrain variations that may pose risks.
Closer to the ground, drone-based aerial surveys capture high-resolution imagery for targeted inspections of remote or hard-to-reach areas, while high-resolution GPS tracking systems ensure accurate location mapping of assets and anomalies.
Meanwhile, on the pipe, advanced sensor networks can be installed to collect real-time, on-the-ground data on pipeline conditions and surrounding environmental factors.
Now the Fun Part: The Data Crunch
Many operators would argue that collecting data is the easy part. That’s because the methods cited above produce an infinite load of raw data that then needs to be processed, analyzed, and transformed into actionable insights.
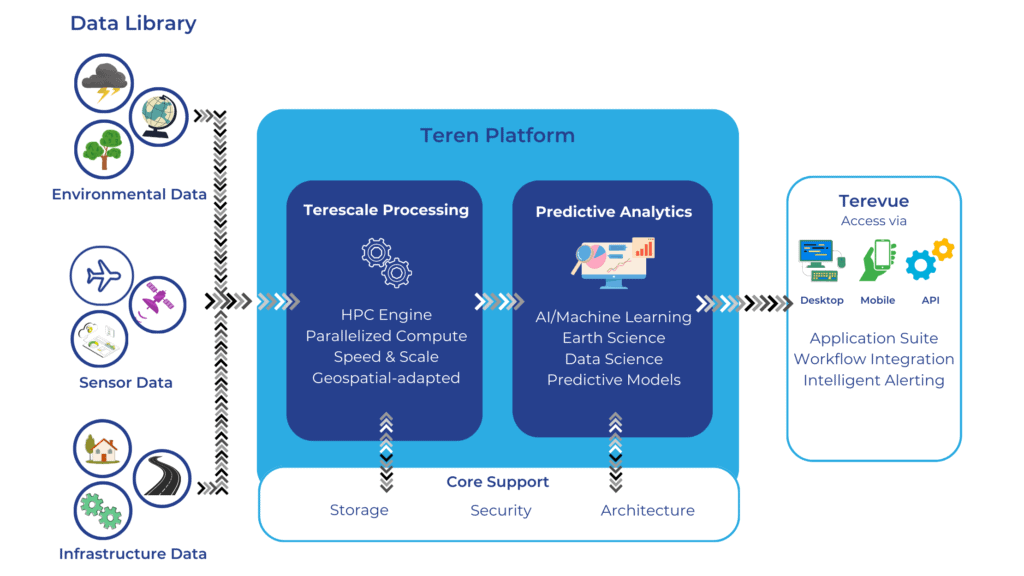
Data Integration and Processing
Combining multiple data sources (Earth observation imagery, ground-based data, and sensor inputs), advanced geospatial data processing techniques are the key to refining the raw data collected. A key element of efficient data integration is having good interoperability between your different monitoring systems; this ensures seamless communication and collaboration.
Meanwhile, data management solutions provide reliable long-term storage and access for pipeline monitoring. Options for operators include cloud-based providers (think AWS, Azure, Google Cloud) that manage vast and varied geospatial datasets, geospatial-focused solutions like Esri ArcGIS Enterprise that enable secure, GIS-focused data handling and visualization, and time-series databases like InfluxDB that are well-suited for processing real-time sensor data. These can all be tied together to create a modern and resilient geospatial data architecture.
Analytical Approaches
Machine learning algorithms play a key role in predictive threat detection across massive datasets, enabling an operator to identify potential failures across an entire infrastructure network. These models learn from historical incident data and environmental trends to forecast where and when threats are most likely to emerge, improving situational awareness and response times.
Multi-layered risk mapping and analysis further visualize overlapping factors to deliver comprehensive assessments, while predictive modeling of environmental changes forecasts the impacts of natural processes, such as erosion, vegetation shifts, or land movement.
Churning Your Geospatial Data Into Actions That Protect the Pipe
So, you’ve harvested your data, and you’ve built a robust house to store and process it. Now the real work can begin: mapping and visualizing your complex data in a way that distills actionable insights. But what are the different ways you can visualize your data? We outline them here.
Digital Terrain Modeling
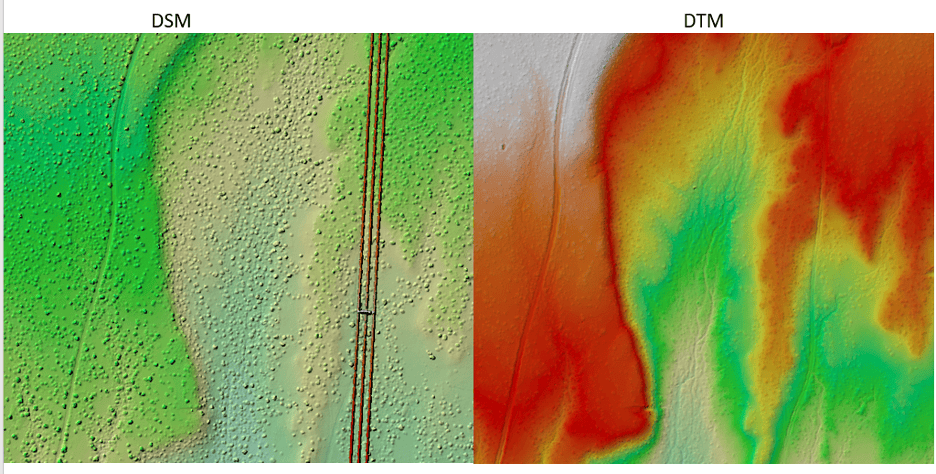
Digital terrain modeling (DTM) is a digital representation of a terrain’s bare-earth surface (with vegetation, buildings removed) that helps assess the stability of pipeline routes. DTM allows for topographical risk profiling of areas where slopes, elevation changes, or geological features may pose threats to infrastructure stability. Terrain change detection algorithms further monitor subtle shifts over time, while geomorphological analysis examines natural processes that can impact pipeline safety, such as erosion or land movement. Combined with elevation and slope risk assessments, these techniques form a foundation for understanding terrain-related vulnerabilities.
Advanced Visualization Platforms
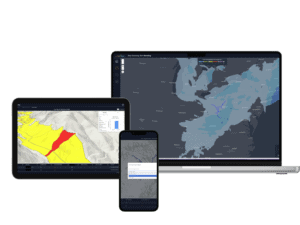
Modern visualization platforms translate complex raw data into intuitive, interactive tools. Examples of these include Google Earth Engine for broad use cases, and ArcGIS within the geospatial industry. Visualization platforms can be built to be more powerfully focused on a purpose, which is the case for Teren’s Platform, which is hyper-focused on environmental risk intelligence on critical infrastructure. Real-time risk visualization tools can highlight and alert to emerging issues as they occur, which is critical in monitoring evolving pipeline risks as they happen.
Geospatial Data Layering

Many operators rely on integrating multiple data layers to enhance the depth and accuracy of their pipeline monitoring. For example, geological substrate mapping reveals subsurface conditions that could affect infrastructure stability, whereas hydrology and watershed analysis identifies risks related to flooding, erosion, or changing watercourses. Vegetation density and encroachment tracking monitors plant growth that could interfere with pipelines, while seismic activity zones highlight regions prone to ground instability. Having a dashboard that that integrates all this different risk data onto one map can help visualize the interplay of environmental factors on the pipeline.
Advanced Risk Modeling
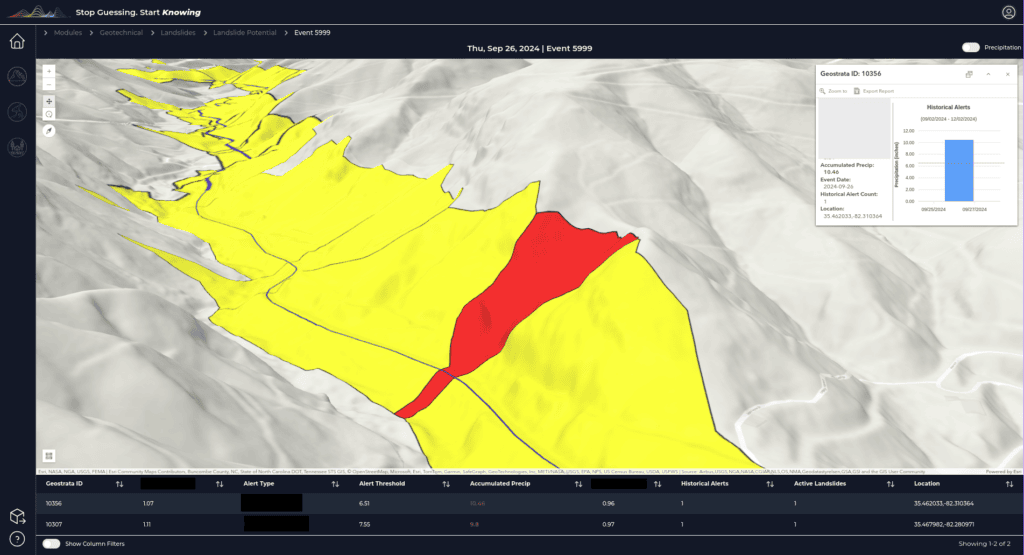
Advanced risk modeling platforms, like Teren’s Terevue, combine elements of all the above techniques to provide clear and actionable representations of potential threats. Color-coded risk gradient mapping highlights the severity of risks across different areas, making it easy to pinpoint high-priority zones. Predictive threat visualization leverages modeling techniques to anticipate where risks may develop in the future, while temporal risk progression models track how threats evolve over time. Multi-factor risk integration combines environmental, geological, and operational data into a unified risk assessment framework, and scenario simulation visualizations allow teams to model the impacts of potential threats, preparing for a range of outcomes.
Conclusion
Geospatial data science, if harnessed correctly, can remarkably transform how we approach pipeline integrity and risk management in an increasingly volatile environmental landscape. By understanding and embracing these advanced technologies, operators can enhance safety, reduce risks, and optimize their infrastructure risk management strategies. While the cost of adopting these technologies can have an upfront cost, their return on investment (in form of averted pipeline failures) makes it worthwhile.
Subscribing to platforms like Terevue also enable operators to benefit from highly advanced pipeline risk visualization, at a fraction of the cost of building at platform in-house.
How can Teren help you?
We'd love to hear from you.
- Ready to dive deeper? -
Knowledge Hub
White Papers
Webinars